Texas

Resilience System


You are here

Climate Change - TX

Primary tabs

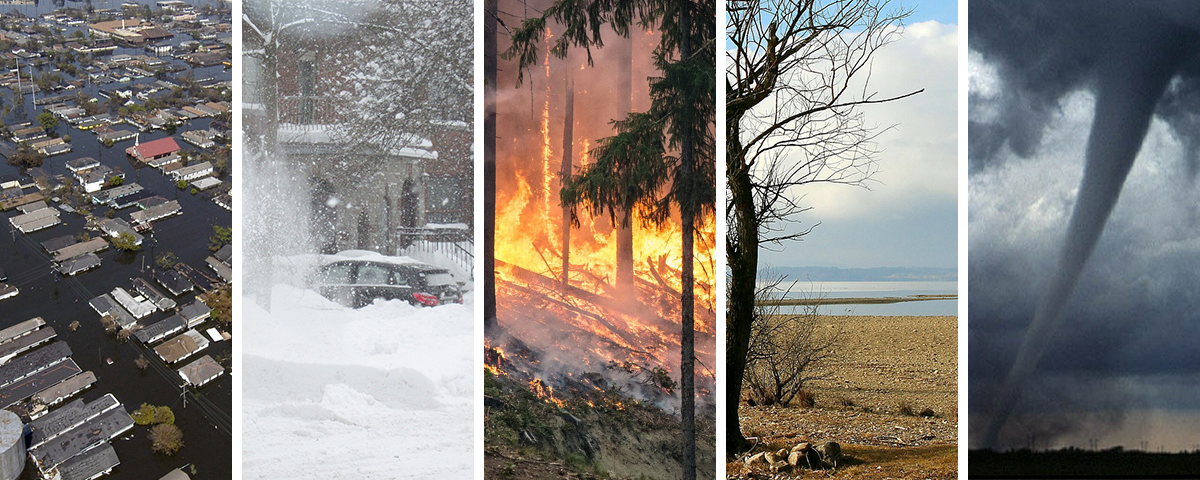
This working group is focused on discussions about climate change.

The mission of this working group is to focus on discussions about climate change.

Members

Kathy Gilbeaux mdmcdonald MDMcDonald_me_com

Email address for group

climate-change-tx@m.resiliencesystem.org

Calculating the Cost of Weather and Climate Disasters


Pixabay.com

ncei.noaa.gov - October 12, 2018

7 things to know about NCEI’s U.S. billion-dollar disasters data

Drought, floods, freezing temperatures, severe storms, tropical cyclones, wildfires, winter storms—every year since 1980, these weather and climate disasters have claimed countless lives and caused billions of dollars in damages in the United States. And, it is NCEI's job to chronicle these disasters and document their impacts to the Nation.

(CLICK HERE - READ COMPLETE ARTICLE)


Country / Region Tags: 
Problem, Solution, SitRep, or ?: 

How Flood Control Officials Plan To Fix Area Floodplain Maps

Graphic of Texas shows the updated rainfall values in inches that define certain extreme events, such as the 100-year storm. Courtesy of NOAA

CLICK HERE - ENLARGED TEXAS MAP (1 page .PDF file)

New topographic and predictive rainfall data means more people in Harris County will be mapped in floodplains.

houstonpublicmedia.org - by Davis Land - November 26, 2018

When Hurricane Harvey left so much of Houston underwater, it highlighted a problem that’s been getting worse for years: Harris County’s existing floodplain maps just don’t work.

In the year since the historic storm, flood control officials have promised to change that, and they already had plans to redo the maps, but new data on the geography of the area and the amount of rainfall forecasters expect in the future means the new maps could look drastically different.

It’s crucial the maps are done right, as people are using the maps, meant to set flood insurance premiums, for more than they are intended . . . 

Country / Region Tags: 
Problem, Solution, SitRep, or ?: 

Climate Change Has Intensified Hurricane Rainfall, and Now We Know How Much


Houston residents Larry Koser Jr. and his son Matthew salvage possessions from their home after Hurricane Harvey. Photo by Erich Schlegel/Getty Images

CLICK HERE - STUDY - Anthropogenic influences on major tropical cyclone events

pbs.org - by Julia Griffin - November 14, 2018

Hurricane Harvey swamped Houston with seven days of pounding rain last August. When scientists went back to look at historical weather patterns, they reported Harvey dumped 20 percent more rain than it typically would have. The culprit: climate change.

(CLICK HERE - READ COMPLETE ARTICLE)

Country / Region Tags: 
Problem, Solution, SitRep, or ?: 

Unusually Warm Sea Water Boosted 2017's Catastrophic Hurricane Season


A Sept. 7, 2017, satellite image from NOAA shows the eye of Hurricane Irma, left, just north of the island of Hispaniola, with Hurricane Jose, right, in the Atlantic Ocean. Six major hurricanes formed in the Atlantic in 2017, including Harvey, Irma and Maria.  (Photo: AP)

CLICK HERE - STUDY - Dominant effect of relative tropical Atlantic warming on major hurricane occurrence

usatoday.com - by Doyle Rice - September 27, 2018

The catastrophic 2017 hurricane season – which included such monsters as Harvey, Irma and Maria – was fueled in part by unusually warm ocean water, a new study suggests.

And because of human-caused global warming, the study said similar favorable conditions for fierce hurricanes will be present in the years and decades to come . . .

 . . . "We show that the increase in 2017 major hurricanes was not primarily caused by La Niña conditions in the Pacific Ocean, but mainly by pronounced warm sea surface conditions in the tropical North Atlantic," the study said.

Country / Region Tags: 
General Topic Tags: 
Problem, Solution, SitRep, or ?: 

West Antarctic Ice Melt Poses Unique Threat to U.S.


Sea level rise contributions from ice melt in different areas, including Greenland (a), West Antarctica (b), East Antarctica (c) and median of global glaciers (d). Values are ratios of regional sea level change to global mean sea level change. Adapted from Kopp et al. 2015.

axios.com - by Andrew Freedman - June 14, 2018

News of Antarctica's accelerating ice melt garnered worldwide headlines yesterday, as scientists revealed that 3 trillion tons of ice has been lost to the sea since 1992 — mostly from the thawing West Antarctic Ice Sheet and Antarctic Peninsula.

Why it matters: The location of the ice melt is important for determining the future of coastal communities, according to climate scientists. And, due to West Antarctica melting, it turns out that the U.S. coastline will be hit extra hard . . .

(CLICK HERE - READ COMPLETE ARTICLE)

Country / Region Tags: 
General Topic Tags: 
Problem, Solution, SitRep, or ?: 

Hurricanes Are Lingering Longer. That Makes Them More Dangerous.


Hurricane Harvey over the Gulf of Mexico in August 2017. The storm stalled over Texas and dropped nearly 50 inches of rain in some places.  Credit NOAA/NASA GOES Project

CLICK HERE - STUDY - A global slowdown of tropical-cyclone translation speed

A new study shows that storms are staying in one place longer, much like Hurricane Harvey did last year.

nytimes.com - by Kendra Pierre-Louis - June 6, 2018

 . . . A study published Wednesday in the journal Nature focuses on what is known as translation speed, which measures how quickly a storm is moving over an area, say, from Miami to the Florida Panhandle. Between 1949 and 2016, tropical cyclone translation speeds declined 10 percent worldwide, the study says. The storms, in effect, are sticking around places for a longer period of time.

(CLICK HERE - READ COMPLETE ARTICLE)

Country / Region Tags: 
General Topic Tags: 
Problem, Solution, SitRep, or ?: 

RECORD-BREAKING OCEAN HEAT FUELED HURRICANE HARVEY


An image of Hurricane Harvey taken by the GOES-16 satellite as the storm collided with the Texas coast. (Image courtesy NASA.)

Ocean evaporation matched up with massive overland rainfall, new analysis finds

CLICK HERE - STUDY - Hurricane Harvey Links to Ocean Heat Content and Climate Change Adaptation

ucar.edu - May 10, 2018

In the weeks before Hurricane Harvey tore across the Gulf of Mexico and plowed into the Texas coast in August 2017, the Gulf's waters were warmer than any time on record, according to a new analysis led by the National Center for Atmospheric Research (NCAR).

These hotter-than-normal conditions supercharged the storm, fueling it with vast stores of moisture, the authors found. When it stalled near the Houston area, the resulting rains broke precipitation records and caused devastating flooding.

"We show, for the first time, that the volume of rain over land corresponds to the amount of water evaporated from the unusually warm ocean," said lead author Kevin Trenberth, an NCAR senior scientist. "As climate change continues to heat the oceans, we can expect more supercharged storms like Harvey."

Country / Region Tags: 
General Topic Tags: 
Problem, Solution, SitRep, or ?: 

Scientists Warn Bigger and Stronger Storms Ahead


CLICK HERE - HURRICANES: A BIT STRONGER, A BIT SLOWER, AND A LOT WETTER IN A WARMER CLIMATE

CLICK HERE - RESEARCH - Changes in Hurricanes from a 13-Yr Convection-Permitting Pseudo–Global Warming Simulation

caribbean360.com - May 23, 2018

American scientists studying past and future weather patterns have warned hurricane conditions could get bigger, stronger and wetter.

Researchers at the National Centre for Atmospheric Research (NCAR) have published a detailed analysis of how 22 recent hurricanes would change if they instead formed near the end of this century. And while each storm’s transformation would be unique, on balance, the hurricanes would become a little stronger, a little slower moving, and a lot wetter.

(CLICK HERE - READ COMPLETE ARTICLE)


Country / Region Tags: 
General Topic Tags: 
Problem, Solution, SitRep, or ?: 

The rise of neglected tropical diseases in the "new Texas"


Fig 1. Percentage of children in poverty ages 0 to 17 by county in Texas in 2015.  Original map drawn by Dr. Melissa Nolan and Mr. Nathaniel Wolf based on data from the US Census Bureau

journals.plos.org - by Peter J. Hotez - January 18, 2018 - https://doi.org/10.1371/journal.pntd.0005581

Abstract

Country / Region Tags: 
General Topic Tags: 
Problem, Solution, SitRep, or ?: 

Pages

howdy folks