Texas

Resilience System


You are here

Visualization

State by state graphics showing vaccine rollout information

The Centers for Disease Control and Prevention said on Saturday about 79.4 million people have received at least one dose of a Covid-19 vaccine, including about 43 million people who have been fully vaccinated by Johnson & Johnson’s single-dose vaccine or the two-dose series made by Pfizer-BioNTech and Moderna.

Country / Region Tags: 
Problem, Solution, SitRep, or ?: 

Why COVID-19 is more deadly in people with obesity—even if they're young

Since the pandemic began, dozens of studies have reported that many of the sickest COVID-19 patients have been people with obesity. In recent weeks, that link has come into sharper focus as large new population studies have cemented the association and demonstrated that even people who are merely overweight are at higher risk.

Problem, Solution, SitRep, or ?: 

National Storm Surge Hazard Maps

https://noaa.maps.arcgis.com/apps/MapSeries/index.html?appid=d9ed7904dbec441a9c4dd7b277935fad&entry=1

This national depiction of storm surge flooding vulnerability helps people living in hurricane-prone coastal areas along the U.S. East and Gulf Coasts, Puerto Rico, U.S. Virgin Islands (USVI), Hawaii, and Hispaniola to evaluate their risk to the storm surge hazard. These maps make it clear that storm surge is not just a beachfront problem, with the risk of storm surge extending many miles inland from the immediate coastline in some areas. If you discover via these maps that you live in an area vulnerable to storm surge, find out today if you live in a hurricane storm surge evacuation zone as prescribed by your local emergency management agency. If you do live in such an evacuation zone, decide today where you will go and how you will get there, if and when you're instructed by your emergency manager to evacuate. If you don't live in one of those evacuation zones, then perhaps you can identify someone you care about who does live in an evacuation zone, and you could plan in advance to be their inland evacuation destination – if you live in a structure that is safe from the wind and outside of flood-prone areas.

National Hurricane Center - National Storm Surge Hazard Maps - Version 2
https://www.nhc.noaa.gov/nationalsurge/

Country / Region Tags: 
Problem, Solution, SitRep, or ?: 

Life Expectancy In Houston Can Vary Up To 20 Years Depending On Where You Live

In Texas, life expectancy varies even more – up to 30 years between some ZIP codes.


Courtesy of UT Southwestern Medical Center

CLICK HERE - INTERACTIVE MAP - Life Expectancy in Texas

CLICK HERE - REPORT - Life Expectancy at Birth in Communities Across Texas: 2005-2014 (26 page .PDF report)

houstonpublicmedia.org - by Katie Watkins - March 4, 2019

Life expectancy in Harris County can vary by about 20 years between ZIP codes,  according to new research by UT Southwestern Medical Center in Dallas . . .

. . . In Texas, the numbers vary even more – up to 30 years between some ZIP codes. While the statewide life expectancy is 78.5 years, the longest life expectancy is in the 78634 ZIP code in Hutto, Texas (97 years). The 76104 ZIP code in Forth Worth has the shortest (66.7 years).

Country / Region Tags: 
Problem, Solution, SitRep, or ?: 

How Flood Control Officials Plan To Fix Area Floodplain Maps

Graphic of Texas shows the updated rainfall values in inches that define certain extreme events, such as the 100-year storm. Courtesy of NOAA

CLICK HERE - ENLARGED TEXAS MAP (1 page .PDF file)

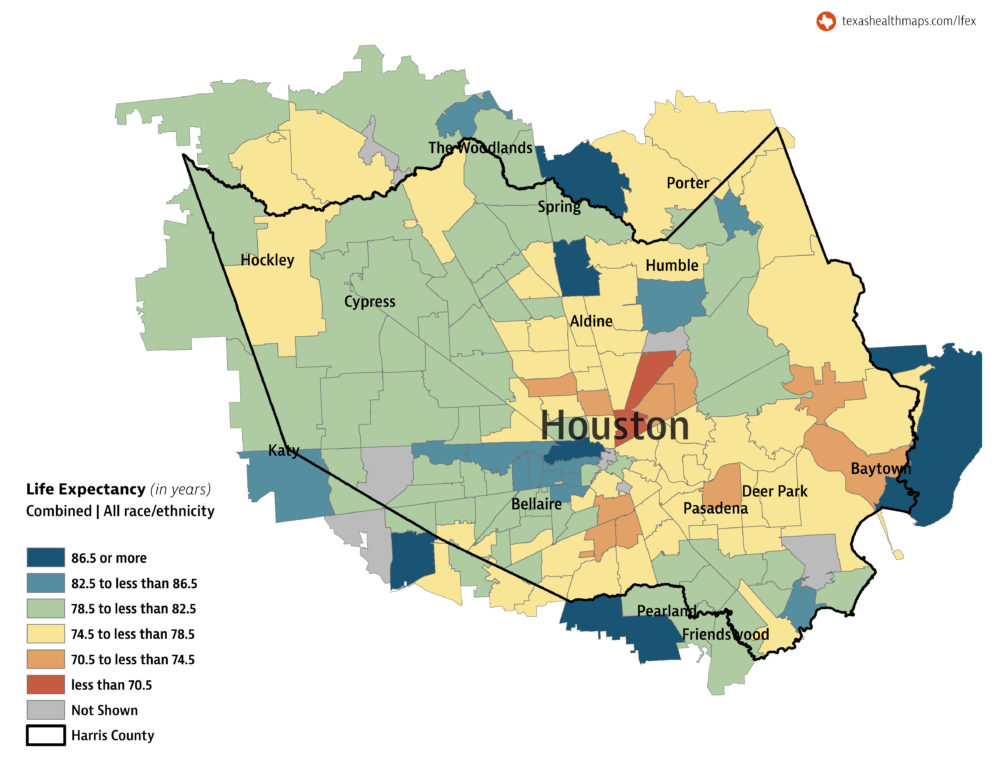
New topographic and predictive rainfall data means more people in Harris County will be mapped in floodplains.

houstonpublicmedia.org - by Davis Land - November 26, 2018

When Hurricane Harvey left so much of Houston underwater, it highlighted a problem that’s been getting worse for years: Harris County’s existing floodplain maps just don’t work.

In the year since the historic storm, flood control officials have promised to change that, and they already had plans to redo the maps, but new data on the geography of the area and the amount of rainfall forecasters expect in the future means the new maps could look drastically different.

It’s crucial the maps are done right, as people are using the maps, meant to set flood insurance premiums, for more than they are intended . . . 

Country / Region Tags: 
Problem, Solution, SitRep, or ?: 

USGS Releases New JavaScript Library for Plotting Water Data for the Nation

submitted by Carrie La Jeunesse


In this example, time-series data for the USGS station at Jacobs Well near Wimberley, Texas (https://waterdata.usgs.gov/nwis/uv?site_no=08170990) is shown from January 9 through 29, 2017. The GWIS plot shows both streamflow and specific conductance in the graph. Double y-axes are used showing how specific conductance changes as streamflow increases.

usgs.gov - February 8, 2017

A new JavaScript library, called GWIS (Graphing Water Information System), can create time-series plots of information measured at U.S. Geological Survey hydrologic data collection sites across the United States.

Developed by the USGS Texas Water Science Center, the user-friendly interface integrates the open-source dygraphs JavaScript charting library with hydrologic data provided by USGS water services.

Country / Region Tags: 
General Topic Tags: 
Problem, Solution, SitRep, or ?: 
Subscribe to Visualization
howdy folks